California truck operators navigate a complex insurance landscape shaped by regulatory requirements, market pressures, and regional pricing variations. Selecting the right coverage requires understanding how vehicle type, operation radius, driver demographics, and carrier priorities influence costs and protection levels. Effective semi truck quote comparison starts with knowing which factors matter most and how to evaluate competing offers against business-specific needs.
The state's truck insurance market reflects both national trends and California-specific challenges, including elevated litigation costs and cargo theft risks. Owner-operators and fleet managers must balance minimum regulatory compliance with optional coverages that address real operational hazards. This guide examines the components of truck insurance pricing, consumer decision priorities, and market conditions affecting California operators in 2026.
Key Takeaways
Semi truck insurance provides financial protection against liability, physical damage, and cargo loss for commercial trucking operations. California's regulatory environment and high-traffic corridors create liability exposure that makes comprehensive coverage essential for protecting business assets and meeting federal and state requirements.
The trucking industry relies on insurance to maintain operations after accidents, equipment failures, or cargo incidents. Without adequate protection, a single claim can force owner-operators out of business or expose fleet managers to financial losses exceeding available capital reserves.
Compulsory insurance represents 64% of the California truck insurance market and includes liability coverage mandated by federal and state regulations. This basic required coverage typically includes auto liability, cargo insurance, and physical damage protection meeting minimum regulatory thresholds.
Optional coverage accounts for 36% of the market and extends protection beyond minimum requirements with higher liability limits, specialized cargo coverage, and additional endorsements. These optional products address specific operational risks like refrigerated cargo spoilage, pollution liability, and non-owned trailer coverage.
Federal Motor Carrier Safety Administration regulations require commercial trucks to maintain minimum liability coverage based on vehicle weight and cargo type. Interstate carriers must carry at least $750,000 in liability coverage, with higher limits required for hazardous materials transport.
California imposes additional state-level requirements that may exceed federal minimums depending on vehicle classification and operation type. Operators must file proof of insurance with both federal and state authorities and maintain continuous coverage to avoid operating authority suspension.
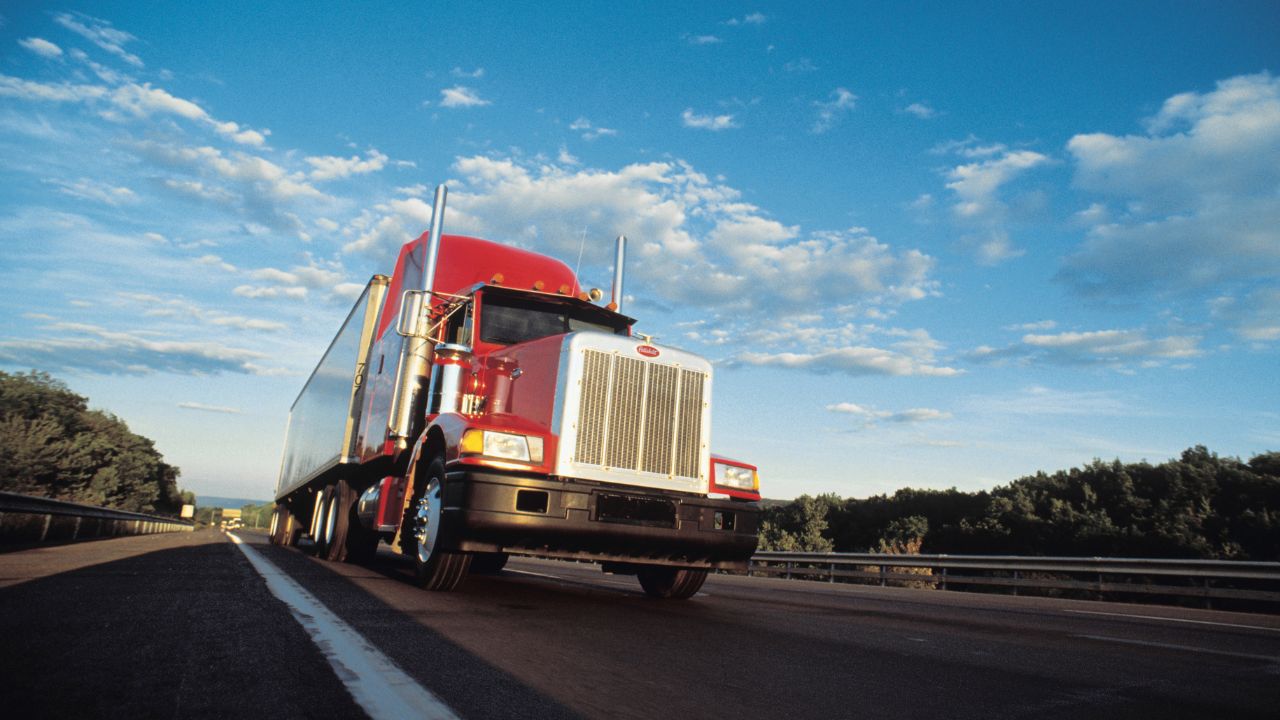
Semi-trailer trucks hold 42% market share in California's commercial truck insurance sector, reflecting their dominance in freight transportation across the state's highway network. These units haul general freight, consumer goods, and industrial materials along major corridors connecting ports, distribution centers, and metropolitan areas.
Dump trucks represent 18% market share and serve construction, mining, and waste management industries concentrated in California's urban growth regions. Insurance for these vehicles addresses unique risks, including equipment damage from heavy loads, third-party property damage at job sites, and liability exposure in residential areas.
Semi truck insurance premiums reflect risk assessments based on vehicle characteristics, driver profiles, and operational territories. California's average annual truck insurance cost of $11,834 ranks 42nd nationally, with individual premiums varying significantly based on these risk factors.
Insurers evaluate multiple data points when calculating premiums, including loss history, vehicle safety features, and compliance records. Understanding which factors carry the most weight allows operators to identify cost-reduction opportunities and compare truck insurance quotes more effectively.
Dump truck insurance ranges from $400 to $1,200+ monthly or $4,800 to $14,400+ annually, depending on operation type and coverage limits. These costs reflect higher physical damage exposure from construction site operations and frequent loading cycles that increase maintenance-related claims.
Owner-operator local operations cost $8,000 to $12,000 annually, while broader radius operations increase premiums to $12,000 to $16,000 per year. New ventures face the highest costs at $14,000 to $20,000+ annually due to a lack of loss history and unproven safety records.
The average commercial truck driver age exceeds 40 years, with 72% of California's driver population in this age bracket. This demographic concentration influences premium calculations as insurers consider experience levels, driving records, and historical claim frequencies.
Twenty percent of drivers are under 35, while 25% are age 55 or older, creating a bimodal distribution that affects underwriting decisions. Younger drivers often face higher premiums due to limited experience, while older drivers may benefit from decades of clean driving records.
California's $11,834 average annual truck insurance cost positions the state at rank 42 nationally, indicating relatively moderate pricing compared to high-cost states. This ranking reflects California's large insurance market, competitive carrier presence, and mixed urban-rural operating environments.
Regional cost variations within California stem from traffic density, accident frequencies, and local litigation patterns influencing claim severity. Southern California's concentration of 35% of commercial trucks creates higher-risk corridors with elevated accident rates, while Central Valley operations at 28% concentration face different risk profiles with more highway miles and fewer urban conflicts.
Cost and premium price receive an importance score of 95 on a 100-point scale, making affordability the dominant factor in insurance purchasing decisions. Owner-operators and fleet managers prioritize finding best semi truck insurance rates that balance comprehensive protection with budget constraints.
Claims service quality follows closely with a score of 92, reflecting industry awareness that premium savings mean little if claims handling creates operational delays. Operators seek carriers that process claims efficiently, communicate clearly, and minimize downtime after covered incidents.
Cost/premium price tops consumer priorities at 95, while coverage options score 88, creating direct tension between affordability and protection breadth. Operators must weigh the financial impact of higher premiums against the risk of inadequate coverage during major claims events.
This prioritization drives purchasing decisions toward carriers offering competitive pricing without sacrificing essential coverages. Effective comparison requires identifying which optional coverages address genuine operational risks versus those adding cost without meaningful protection value.
Carrier reputation scores 85 in importance rankings, reflecting operator concerns about insurer responsiveness, claims fairness, and industry expertise. Fleet managers and owner-operators rely on peer recommendations and industry reputation when evaluating carriers beyond price considerations.
Financial stability receives an 80 importance score as operators recognize that low premiums provide no value if an insurer lacks resources to pay claims. This priority drives research into carrier ratings, market presence, and claims-paying history before finalizing coverage decisions.
Claim service quality ranks second overall at 92, surpassing coverage options and carrier reputation in decision influence. Operators value prompt claim resolution, clear communication, and minimal administrative burden when accidents or equipment failures occur.
Ease of quoting scores 75, indicating moderate importance relative to other factors but still influencing carrier selection. Streamlined quoting processes reduce friction in obtaining insurance quote factors and comparing multiple offers efficiently.
Effective semi truck quote comparison requires a structured evaluation of pricing tiers, coverage differences, and carrier service capabilities. Operators benefit from creating comparison matrices that display premium costs alongside coverage limits, deductibles, and optional endorsements across multiple carriers.
This systematic approach prevents overlooking critical coverage gaps or cost differences that emerge only through side-by-side analysis. Operators should request quotes using identical specifications to ensure valid comparisons and identify which carriers offer competitive rates for their specific risk profile.
Price comparison matrices organize quotes into budget, mid-range, and premium tiers that reflect different coverage levels and service commitments. Budget tiers typically offer minimum required coverage with higher deductibles, while premium tiers include expanded liability limits, lower deductibles, and additional endorsements.
This tiered structure allows operators to evaluate trade-offs between upfront premium costs and potential out-of-pocket expenses during claims. Comparing annual costs across tiers reveals which coverage enhancements justify higher premiums based on operational risk exposure.
Compulsory insurance's 64% market share reflects widespread focus on meeting minimum regulatory requirements rather than expanding protection. Operators must understand which coverages satisfy federal and state mandates versus those addressing risks beyond legal minimums.
Optional coverage at 36% market share includes higher liability limits, comprehensive physical damage protection, and specialized endorsements for unique cargo or operational hazards. Distinguishing between required and optional elements prevents overpaying for duplicate coverage while ensuring adequate protection for business-specific risks.
Record cargo theft levels in 2024 continue at elevated rates in 2025, creating new underwriting considerations that affect coverage availability and pricing. Operators must evaluate whether standard cargo policies provide adequate limits and whether additional theft prevention measures qualify for premium discounts.
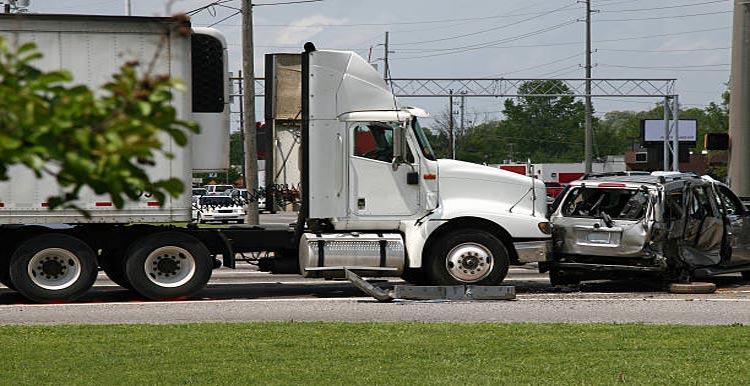
Nuclear verdicts represent large litigation settlements increasing across the trucking industry, driving liability coverage costs higher as insurers adjust for catastrophic claim potential. These developments make adequate liability limits critical, as settlements exceeding policy limits expose operators to personal or business asset risk.
The global truck insurance market reached USD 166.99 billion in 2026, with projections of USD 341.03 billion by 2035, representing an 8.5% compound annual growth rate. U.S. Commercial Truck Fleet Insurance demonstrates a 6.2% CAGR from 2026 to 2033, indicating sustained market expansion driven by fleet growth and regulatory requirements.
Rate increases are moderating to low single digits in 2026 after years of double-digit growth, providing relief to operators facing compressed profit margins. This moderation reflects improved loss ratios and increased carrier capacity entering the market.
Global truck insurance market growth from USD 166.99 billion in 2026 to USD 341.03 billion by 2035 signals long-term expansion driven by freight volume increases and regulatory compliance needs. The 8.5% CAGR indicates sustained demand for commercial truck coverage as e-commerce and supply chain complexity drive fleet expansion.
U.S. Commercial Truck Fleet Insurance's 6.2% CAGR from 2026 to 2033 reflects domestic market dynamics, including aging vehicle fleets requiring higher coverage limits. Rate increases moderating to low single digits in 2026 suggest carriers have achieved pricing adequacy, stabilizing premiums for operators.
Commercial Auto Liability maintains a combined ratio near 113%, indicating unprofitable market conditions where claim costs exceed premium revenue. This unfavorable ratio forces carriers to increase rates, tighten underwriting standards, or exit market segments that consistently produce losses.
Nuclear verdicts increase litigation costs, create catastrophic claim exposure that elevates liability premium calculations across all operators. These large settlements force insurers to reserve higher amounts for potential claims, driving premium increases even for operators with clean loss histories.
Urban areas demonstrate 78% insurance adoption rates, reflecting higher regulatory compliance and greater accident exposure that motivates comprehensive coverage. Dense traffic, higher property values, and frequent interactions with passenger vehicles create liability scenarios that make adequate insurance essential.
Suburban areas show 65% adoption while rural areas reach only 52%, indicating lower perceived risk and potentially less stringent enforcement. These adoption differences influence market dynamics as carriers concentrate capacity in urban markets where regulatory compliance and claim frequency support consistent premium volume.
The average truck driver age exceeds 40 years, with 72% of California's commercial driver population in this age bracket. This demographic concentration influences underwriting approaches as carriers develop pricing models reflecting experience levels and career stability patterns.
Twenty percent of drivers under age 35 represent the industry's future workforce, though their limited experience often results in higher initial premiums. The 25% of drivers age 55 and older bring extensive experience but may face age-related considerations affecting insurability.
The 72% concentration of drivers age 40 and older creates a stable, experienced workforce that generally produces favorable loss ratios for insurers. This demographic pattern influences premium calculations as carriers assign lower risk scores to operators employing experienced drivers with established safety records.
The 20% of drivers under 35 face higher premiums due to limited experience and statistically higher accident rates. The 25% of drivers age 55 and older represent the industry's most experienced segment, though carriers may apply different underwriting criteria for older drivers.
Southern California's 35% concentration of commercial trucks creates dense operating environments with elevated accident frequencies and higher claim costs. This regional concentration drives premium variations as insurers account for traffic congestion, urban liability exposure, and higher repair costs in metropolitan areas.
Central Valley operations represent 28% of California's commercial truck concentration and feature longer highway routes with different risk profiles than urban operations. These regional differences affect pricing as carriers evaluate accident patterns, cargo theft risks, and claim severity specific to each operating territory.
Urban insurance adoption at 78% reflects stronger regulatory enforcement, higher commercial activity, and greater awareness of liability exposure in metropolitan markets. This high adoption supports competitive carrier presence and potentially more favorable pricing due to larger risk pools.
Suburban adoption of 65% and rural adoption of 52% indicate lower insurance penetration in areas with less commercial traffic. These lower rates create challenges for carriers building adequate risk pools and may result in higher premiums for operators in underserved markets.
Owner-operators must align coverage selections with business size and operation radius to avoid paying for unnecessary protection or leaving critical risks uninsured. Local operations costing $8,000 to $12,000 annually require different coverage structures than broader radius operations at $12,000 to $16,000 per year.
Fleet managers overseeing multiple vehicles face additional complexity in balancing individual vehicle coverage with fleet-wide policies that may offer economies of scale. Understanding how operation parameters affect pricing helps both groups make informed decisions.
Owner-operator local annual costs of $8,000 to $12,000 reflect limited territorial exposure and lower mileage compared to broader radius operations. Local operators should focus on adequate liability limits for their operating environment while avoiding unnecessary coverage for out-of-territory risks.
Owner-operator broader radius operations at $12,000 to $16,000 annually require expanded coverage addressing multi-state exposures and increased accident probability from higher annual mileage. New ventures paying $14,000 to $20,000+ face elevated premiums due to a lack of loss history.
Cost/premium price at importance score 95, and claim service quality at 92 should anchor coverage decisions, as these factors most directly impact operational success. Operators must identify which carriers deliver competitive pricing while maintaining responsive claims handling that minimizes downtime.
Coverage options scoring 88, carrier reputation at 85, and financial stability at 80 provide secondary evaluation criteria. This hierarchy helps operators conduct focused truck insurance comparisons without becoming overwhelmed by less critical factors.
California's average annual truck insurance cost of $11,834 provides a baseline for budget planning, though individual costs vary based on vehicle type, operation radius, and driver profiles. This state-level average, ranked 42nd nationally, indicates California offers relatively moderate pricing.
Operators should use California's rank 42 position as context when evaluating quotes, recognizing that competitive rates should align with or improve upon state averages adjusted for specific risk factors. Budget planning must account for potential rate increases despite current moderation.
Selecting truck insurance in California requires balancing regulatory compliance, risk protection, and cost management within a market shaped by litigation trends, cargo theft concerns, and regional pricing variations. Operators who understand how vehicle type, driver demographics, and operation radius influence premiums can identify coverage that protects their business without overpaying. The data shows cost remains the primary decision driver at an importance score of 95, yet claims service quality at 92 demonstrates that operators value responsive support during critical incidents.
Market conditions in 2026 present both challenges and opportunities as the rate increases moderately to low single digits after years of double-digit growth. The commercial auto liability combined ratio near 113% indicates carriers continue managing unprofitable conditions, making careful carrier selection essential. Owner-operators and fleet managers should focus on carriers demonstrating financial stability, industry expertise, and proven claims service capabilities rather than selecting coverage based solely on premium cost.
SoCal Truck Insurance understands the pressures California operators face when managing insurance costs while protecting income-generating assets. Our approach focuses on identifying coverage that addresses your specific operational risks and business priorities without unnecessary complexity.
You have seen what shapes California semi truck insurance pricing, from operation radius and driver experience to the coverage choices that match your real risks. The next step is putting that knowledge to work with a quote that fits how you actually run.
For more than 25 years, SoCal Truck Insurance has helped owner-operators and fleet managers across Southern California compare coverage, control costs, and keep their trucks earning. You get a dedicated agent who knows your routes and your priorities, 24/7 support when something goes wrong, and bilingual service whenever you need it.
Contact us or visit our Downey office at 8135 Florence Ave #101, Downey, CA 90240 to compare your options and secure coverage that protects your business.